关于trend_score和ROC的计算问题

-
trend_score
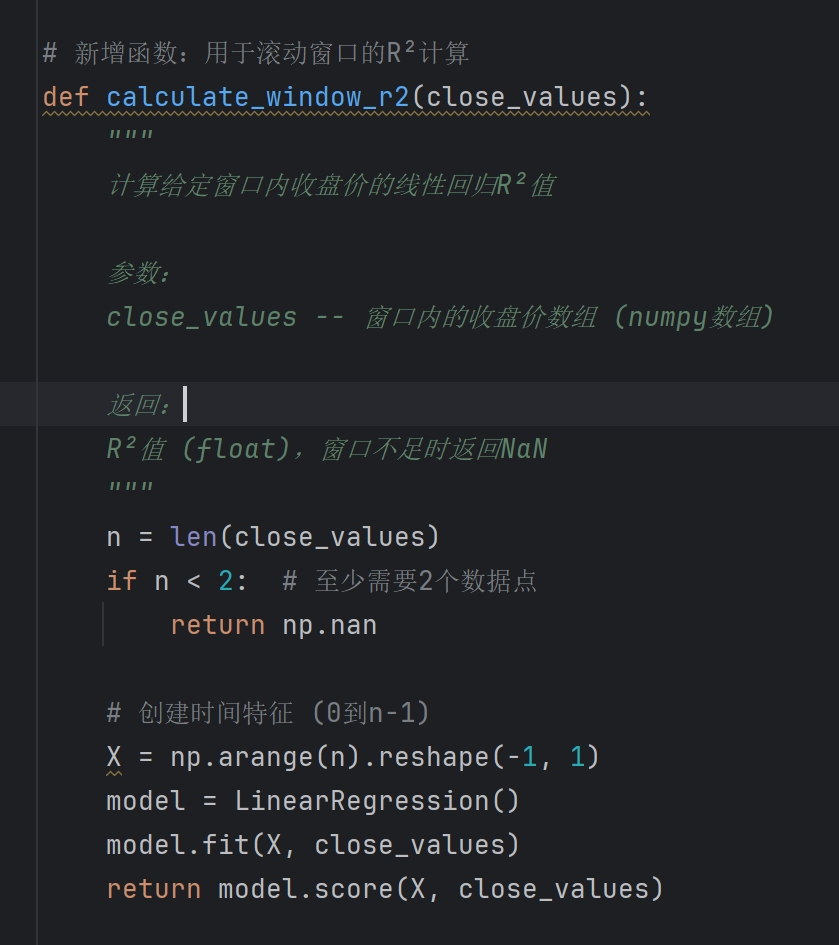
根据该描述是如果要计算20日 trend_score 是不是就是20天的斜率值*拟合度R2的计算结果
我使用from sklearn.linear_model import LinearRegression直接计算R2
ROC是根据公式进行计算的:
ROC = (当前收盘价 - N周期前收盘价) / N周期前收盘价 * 100
最后回测出来的结果和平台展示的收益信息有一些不同,我最多只能跑到40多倍的收益,平台上显示是接近60倍的收益

而且最后买入的持仓也和平台上的显示不一致,这块有哪位大神能帮忙解答下?
平台显示策略:
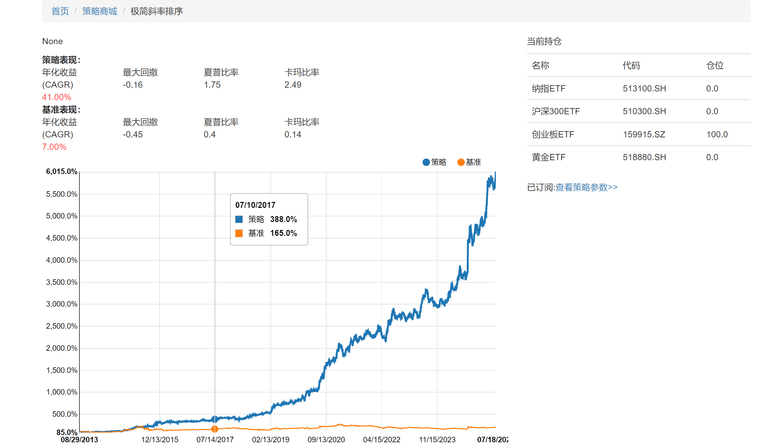
我自己回测最后买的是沪深300和平台上买入创业版ETF不太一致:

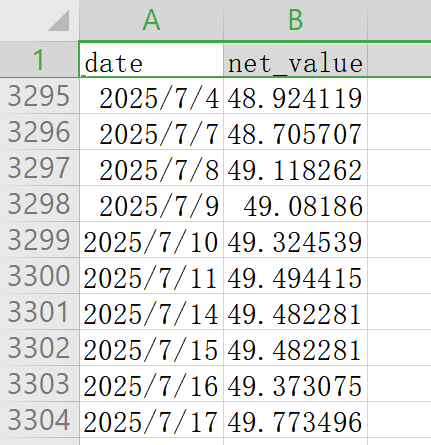
收益回测出来大概是49倍左右:
-
这个因子有计算解释么?
-
我感觉是python包计算差异, 算法差异
-
from sklearn.linear_model import LinearRegression
from sklearn.metrics import r2_scoredef calculate_R2_with_slope(close_values,K):
n = len(close_values)
if n < K:
return np.nan
# 获取最新的close_values数据
close_values = close_values[-K:]
n = len(close_values)
# 取close_values窗口滑动向前的20天数据
x = np.arange(n).reshape(-1, 1)
model = LinearRegression()
model.fit(x, close_values)
# 获取斜率(回归系数)
slope = model.coef_[0]
#print(f"斜率(回归系数): {slope}")
X_test = np.array(x)
y_test= np.array(close_values)
# 获取拟合度(R-squared值)
y_pred = model.predict(X_test)
r2 = r2_score(y_test, y_pred)
return r2*slope@calc_by_symbol
def trend_score(se: pd.Series,d):
# 这里使用滑动窗口获取 斜率*拟合度
return se.rolling(window=d).apply(lambda x: calculate_R2_with_slope(x.values, d))我这里的计算方式是这样的,也回测不出来公开策略的60%多倍收益,只测试出来37倍收益
-
我这里修改了一下,拟合直线的斜率改成了暴力两点 斜率
获取斜率(回归系数)
slope = model.coef_[0]
暴力首尾两点斜率
slope=(close_values[n-1]-close_values[0])/close_values[0]这样计算出来总收益为50.57812057000028
-
下面这个是星主的源码:
@staticmethod
def trend_score(series: pd.Series, period=25):
def _trend_score(close, period=25):
"""
向量化计算趋势评分:年化收益率 × R平方
:param close: 收盘价序列(np.array或pd.Series)
:param period: 计算窗口长度,默认25天
:return: 趋势评分数组,长度与输入相同,前period-1位为NaN
"""
if len(close) < period:
return np.full_like(close, np.nan)y = np.log(close) windows = np.lib.stride_tricks.sliding_window_view(y, window_shape=period) x = np.arange(period) # 预计算固定值 n = period sum_x = x.sum() sum_x2 = (x ** 2).sum() denominator = n * sum_x2 - sum_x ** 2 # 滑动窗口统计量 sum_y = windows.sum(axis=1) sum_xy = (windows * x).sum(axis=1) # 回归系数 slope = (n * sum_xy - sum_x * sum_y) / denominator intercept = (sum_y - slope * sum_x) / n # 年化收益率 annualized_returns = np.exp(slope * 250) - 1 # R平方计算 y_pred = slope[:, None] * x + intercept[:, None] residuals = windows - y_pred ss_res = np.sum(residuals ** 2, axis=1) sum_y2 = np.sum(windows ** 2, axis=1) ss_tot = sum_y2 - (sum_y ** 2) / n r_squared = 1 - (ss_res / ss_tot) r_squared = np.nan_to_num(r_squared, nan=0.0) # 处理零方差情况 # 综合评分 score = annualized_returns * r_squared # 对齐原始序列长度 full_score = np.full_like(y, np.nan) full_score = pd.Series(index=close.index) full_score[period - 1:] = score return full_score return series.groupby(level='symbol', group_keys=False).apply(_trend_score)